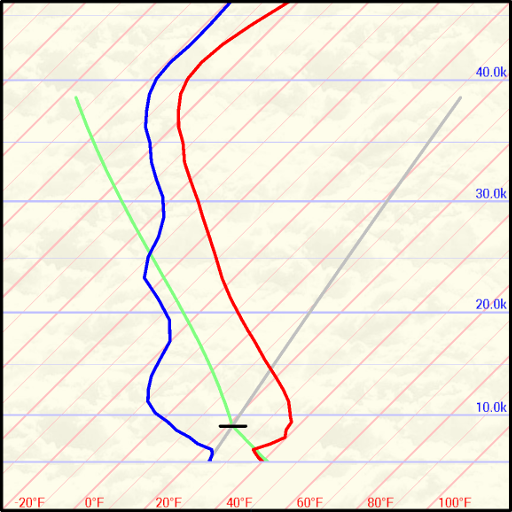
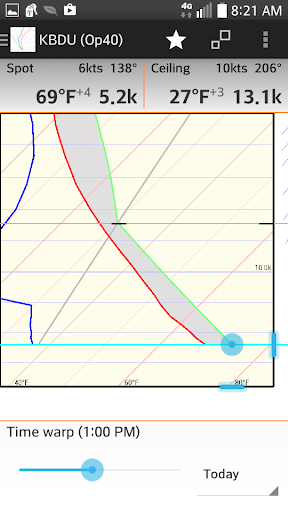
Skew-T Log-P diagrams are commonly used for weather analysis and forecasting.
They graph weather balloon data to show the vertical profile of the temperature and dew point through the atmosphere.See the following Finger Lakes Soaring Club web link for a great article describing how glider pilots use skew-t graphs to predict weather for a days flight.
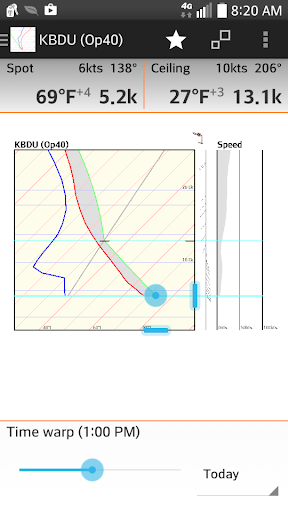
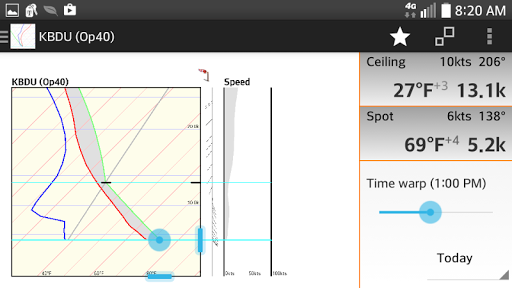
http://www.flsc.org/portals/12/PDF/Read_Skew_T.pdfFeatures: Uses data from http://rucsoundings.noaa.gov/ Automatically download the days weather data Use the slider to quickly view all hour-by-hour graphs.
Zoom to inspect the graph details Configurable units and graph lines Use different weather models Show forecast graphs for the next few days Saved favorites to quickly view different locations and/or weather models.
Here mode uses GPS to easily get graphs for your current location.
Load waypoints from files.
https://andro.io/app/skewt
 Power 100

Android app profile
Skew-t for Android – Latest Version & Features
by Alan Walls
★★★★★
(0 ratings)
Rate this app
How do you feel about Skew-t?
Thanks for your feedback!
> 2.2k
Monthly Downloads
~$900
Estimated Cost
Screenshots