
Realtime Charts is a plugin for the Torque Pro App and is the perfect tool for the automotive hobbyist, professional or DIY mechanic who wants to monitor, tune, diagnose or analyze their vehicles performance.
This plugin app allows the user to graph multiple engine sensors (i.e.
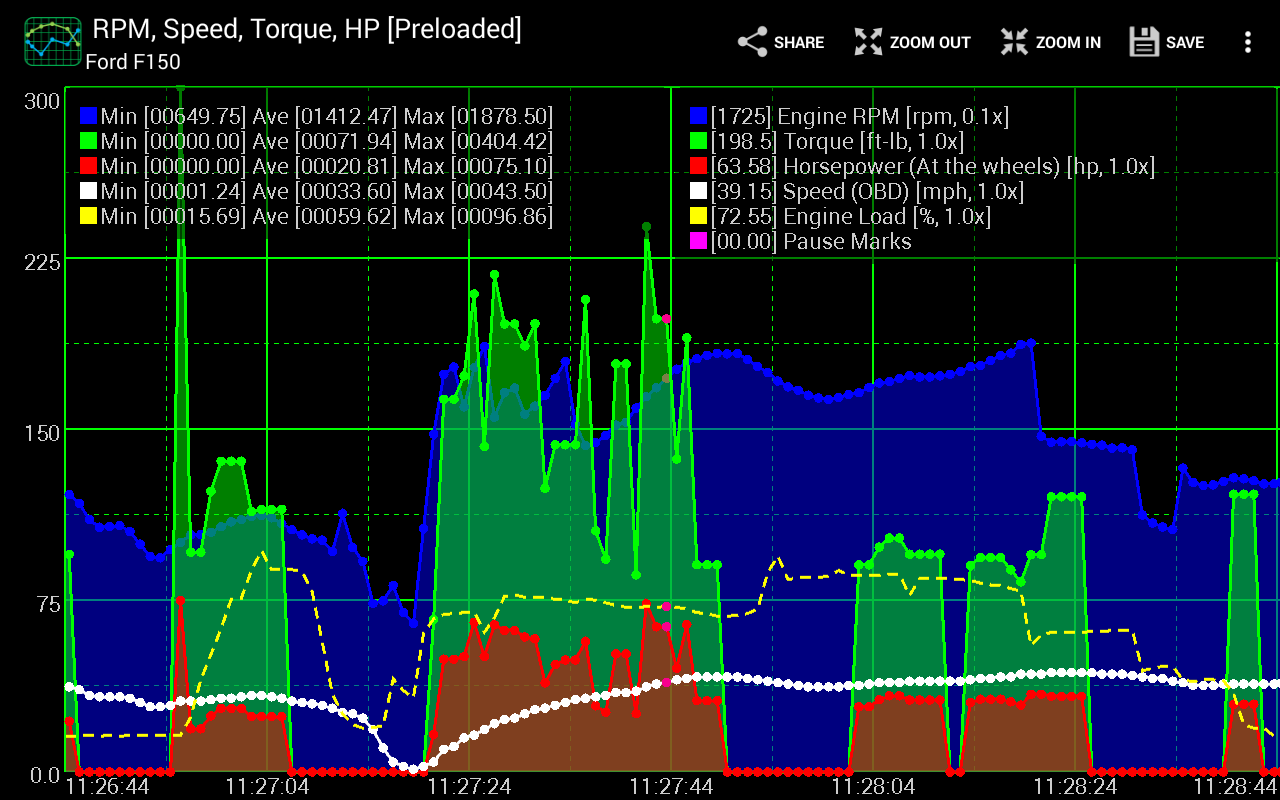
RPM, Speed, MPG, HP, Torque, up to 10 different PIDs) simultaneously in real-time on an Android phone or tablet.
The software graphs each engine sensor as a "series" on your Android device, allowing for in depth monitoring of the vehicles performance.
You can create your own custom charts (up to 100), specifying the sensors, sampling frequency, chart colors, series attributes, and much more.
You can create stunning screen shots to share on social media and automotive forums.
New Feature in V1.16!
Support for starting capture of sensor data based on one or more sensors matching your specific criteria!
For example, refine your captures to when RPMs reach 2000 or speed is 50 mph or when both are trueNew Feature in V1.14!
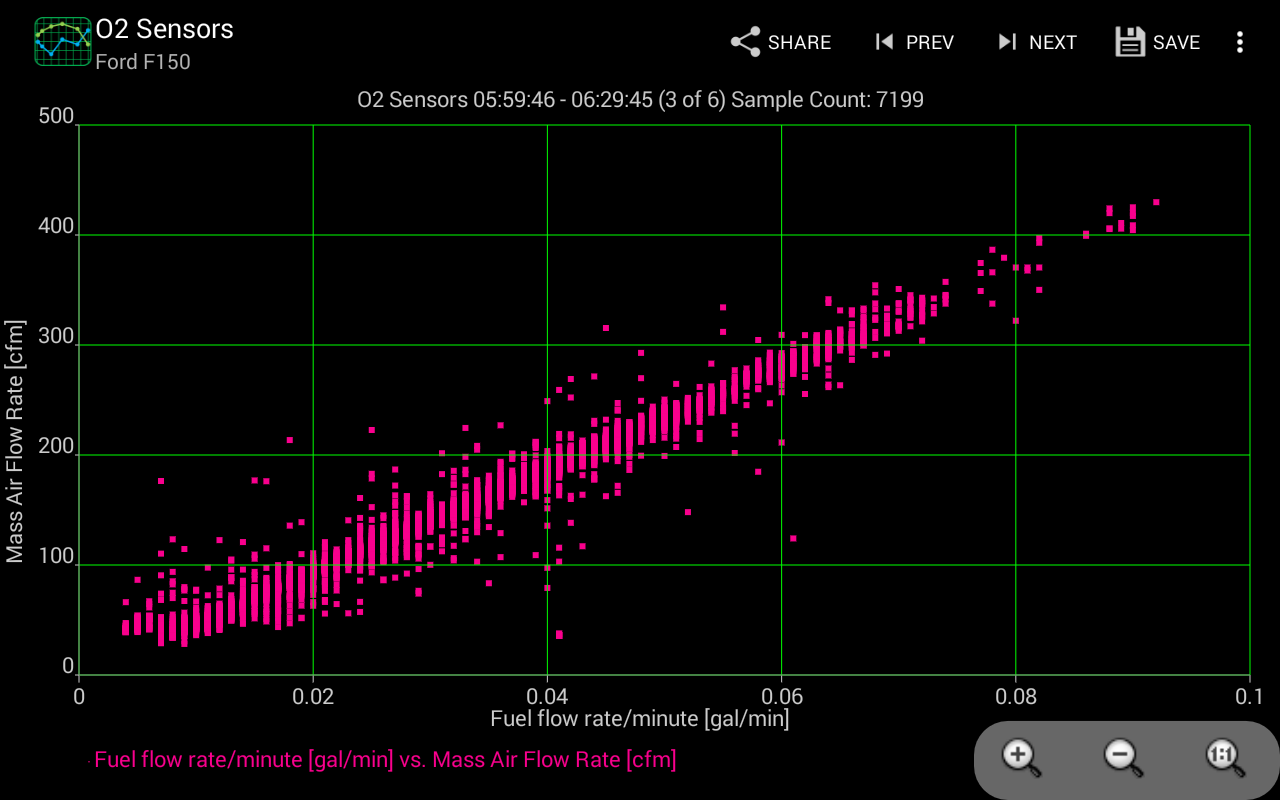
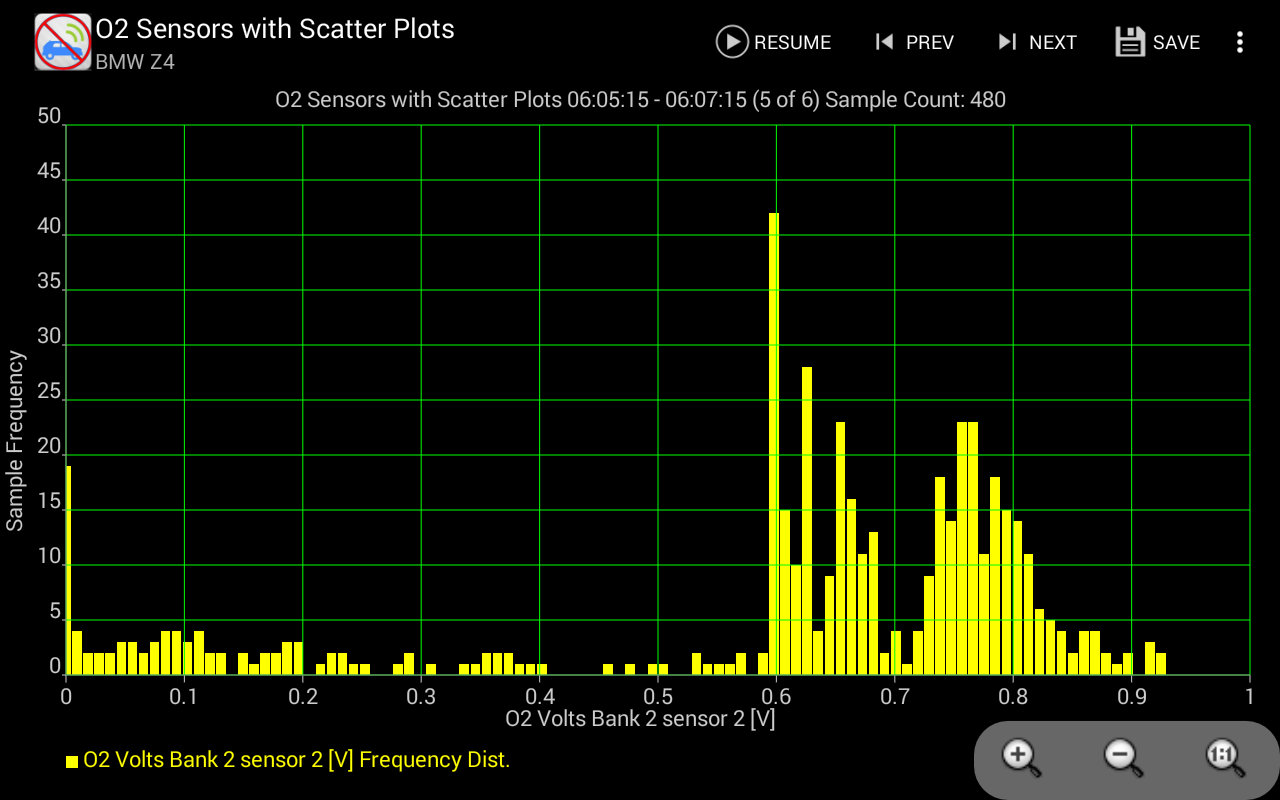
Support for scatter plot analysis (in real time or on recorded/saved sessions)!Share your charts with us at: https://www.facebook.com/Realtime-Charts-for-Torque-Pro-1669817409964470 email: [email protected] Twitter: @Realtime_ChartsPlease note: FOR THIS APP, YOU MUST HAVE: 1.
A wireless OBD 2 adapter for your car.
2.
The "Torque Pro" app needs to be installed on your device.
This is a plugin app for Torque Pro App.
Visit Ian Hawkins Torque Site for help with Torque setup http://torque-bhp.com/forums/?wpforumaction=viewforum&f=1.0 & http://torque-bhp.com/wiki/Main_Page Watch this install video to learn about OBD-2 devices.
http://alturl.com/knxowAlso, check out Caristas adapter -> https://caristaapp.com/adapterRealtime Charts Features: - Monitor and graph up to 10 engine sensors in real-time - Perform real-time scatter and frequency plot analysis on engine sensors - Create stunning screen shots to share on social media and car forums - Create up to 100 custom charts with different sensor combinations - Save data to device and load for later review.
- Auto-pause chart option when the vehicle is stopped.
- Trigger capture of data on custom senor thresholds - Auto-save trip data option when the vehicle is shut off or user ends session.
- Scroll and zoom charts with finger tips or zoom buttons - Settable sampling frequency from 100ms to 10 sec.
- Time of day X axis labels - Session pause and resume with time compensation - Auto-scaling or fixed y-axis - Add and delete sensors from running charts.
- Change series and chart attributes (color, lines, ...) on running charts - Dynamic scaling of series datapoint (0.01x, 0.1x, 1x, 10x, 100x, ...) - Graph running averages for engine senors - Upper and lower engine sensor value limits - Preferred Torque Unit Support (English or Metric units) - Simple or custom color selection tools - Export Excel CSV data files - Simulation mode lets you design charts without an ECU connection - Automatic trip storage space management - Share your charts configurations with friends - Record sensors while RTC app is in the background (i..e.
while using apps like Torque Pro Realtime Info (Gauges) or Google Maps)Supported Android Versions: V2.3 and above.
Tested on Motorola Electrify w/V2.3 (Gingerbread), Samsung Tab 4 w/ V4.4 (KitKat) and iRulu eXpro X1Plus V5.1 (Lollipop) & Lenovo V7.1 (Nougat), Samsung Tab A7 (R) using Carista OBD2 Bluetooth Adapter (recommended!).Privacy Policy: Realtime Charts for Torque Pro does not collect or upload any personal user, location, or usage data.1.52 Added averages to scatter plot legend1.54 Fixed Kia EV Custom PIDs, added Y axis label counts1.55 Fixed reconnect logic to Torque Pro Service, scrolling perf, watchdog timeouts1.56 Fixed Torque Pro Fuel Status PID (03), added Fuel Status loop decoding (Open/Cold, Closed/02, ...) 1.57 Fixed Android Q&R external storage access issue1.59-62 Fixed Android 11 export csv and share1.63 Added Sharing Trip Data files1.64 Using API 30
M
5
★
★
★
★
★
Great product. Shows graphically what parameters are being monitored.