Explore the Central Limit Theorem, learn about the correlation coefficient and linear regression, and visualize the coverage probability of confidence intervals or Type I & II Errors in hypothesis testing.Build understanding by experiencing these important concepts step-by-step.
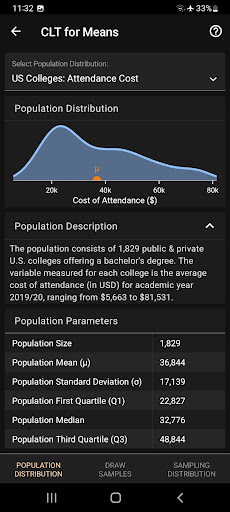
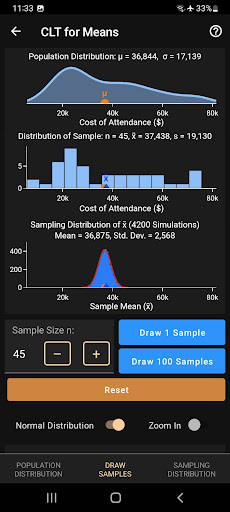
For students and teachers of statistics.The Art of Stat: Concepts app provides access to the following modules:- Central Limit Theorem for Means- Central Limit Theorem for Proportions- Explore Correlation- Explore Linear Regression- Explore Coverage- Errors & PowerCLT: Select from several real population distributions (left and right-skewed or fairly symmetric) and simulate taking a sample from the population.
Visualize how the sampling distribution builds, step-by-step.
Explore the effect on the sampling distribution as you increase the sample size.
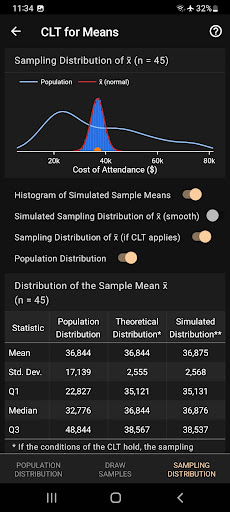
Overlay the normal distribution.
Compare the sampling distribution of the mean to the population distribution, both visually and in terms of key statistics.Explore Correlation/Linear Regression: Create (and delete) points in a scatterplot by tabbing on the screen.
Show the regression line or residuals.
Simulate scatterplots and guess the correlation coefficient.
Coverage and Errors: Explore what 95% coverage for a confidence interval for a population mean or proportion implies.
See the Type I and Type II error and explore how they depend on the sample size and the true parameter value.
Find and visualize the power of a hypothesis test.
https://andro.io/app/concepts-kg8h
 Power 100

Android app profile
Art of Stat: Concepts for Android – Latest Version & Features
by Bernhard Klingenberg, Art of Stat
★★★★★
(0 ratings)
Rate this app
How do you feel about Art of Stat: Concepts?
Thanks for your feedback!
> 2.2k
Monthly Downloads
~$900
Estimated Cost
Screenshots