Immersive Dashboards App for Analytics PlusAnalytics Plus - Dashboards is an immersive native mobile app to access & explore your business dashboards in Analytics Plus.Why is Analytics Plus - Dashboards app a must have analytical app?- An immersive native appAn immersive purpose-built app just for accessing all your dashboards.
Enjoy analytics like never before with intuitive gestures.- Make right data decisions - anytime, anywhere Easily access your Analytics Plus dashboards anytime and from anywhere.
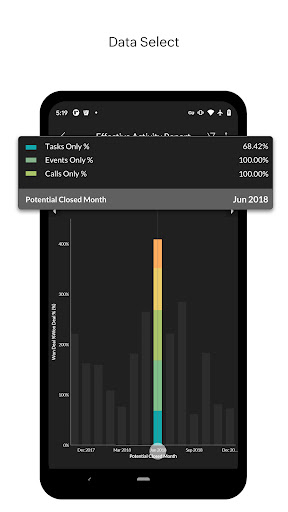
Stay well-equipped with your changing data trends and have your data, literally, on your finger tips.- Cool visualizations with myriad exploration optionsSupports a lot of interactive options that allow you to interact; interpret; and fork your data, and gain deeper insights.
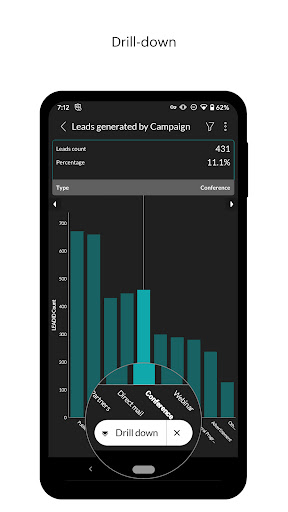
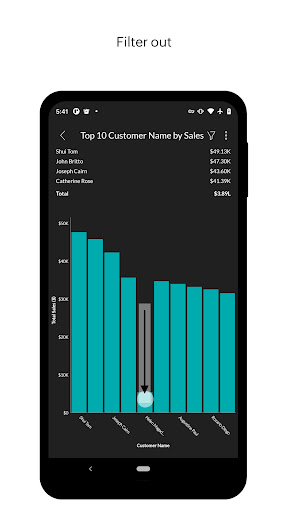
You can also change your chart types and drill-down your data from the comfort of anywhere with just a few taps.- Filter your wayDynamically filter your data to include/exclude any data value from your visualization.
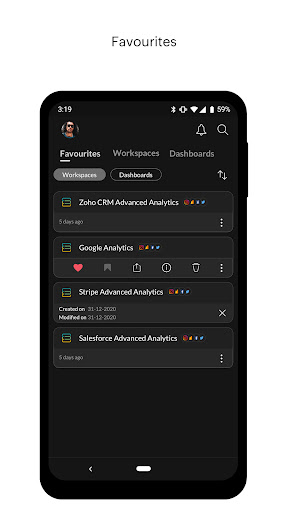
You can also dynamically filter the reports using the User Filters created in the dashboard/report.- Organise as you wantContextually equipped with options to sort, favorite, default, and delete workspaces, dashboards, and reports.
https://andro.io/app/aplusdashboards
 Power 100
Android app profile
Analytics Plus - Dashboards for Android – Latest Version & Features
by ManageEngine
★★★★★
(0 ratings)
Rate this app
How do you feel about Analytics Plus - Dashboards?
Thanks for your feedback!
> 2.2k
Monthly Downloads
~$900
Estimated Cost
Screenshots