
AllegyMonitor is an application to record daily hay fever and bronchial asthma symptoms, always updatedand traceable even after many months, allowing you to return to your physician exactly the type andseverity of symptoms suffered even after time.You can record daily, for all periods desired, allergic symptoms related to the nose, eyes, respiratorysystem, to answer questions on quality of life (QoL) due to allergic disease and evaluate using a VAS (VisualAnalogue Scale), your daily state of health / illness.You can see your daily symptoms represented in graphical format used by scores worldwide(Rhinoconjunctivitis Total Symptom Score [RTSS], Asthma score, QoL and VAS) allowing you to monitor yourillness.These same graphs will be generated in pdf format that you can print and/or send by mail to your doctor orhealth care professional/specialist so that he can take care of you in the best possible way.Special features- Access via login- Accurate and easy user interface- Daily recording of symptoms by the symbolism of the smile- Registration of the following symptoms: > Eye: itching, tearing and redness/burning.
> Nose: sneezing, runny nose, stuffy nose, itchy.
> Respiratory System: coughing after exercise, breath with whistling and/or wheezing, wheezing/ shortness of eath, sense of oppression/chest tightness.
> Disturbed sleep due to asthma and/or hay fever.
> Unscheduled visit to the doctor or to the emergency room for asthma.
> Limitation of daily activities and/or problems at work / school due to hay fever.
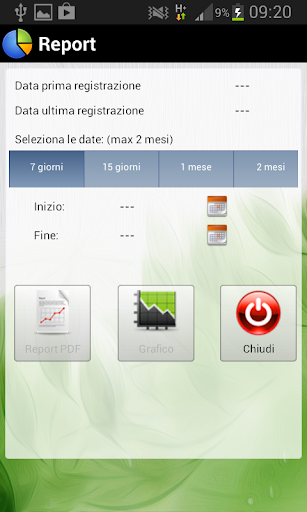
> VAS (visual analogue scale) from 0 (very well) to 10 (worse than that I cannot stand).- Graphical display of (1) eye-nasal symptoms (RTSS), (2) respiratory asthma, (3) and QoL (4) of the SEA.- For each chart is described how it is calculated and how the result should be interpreted.- The background of the graph is colored with three bands of different colors (green, yellow, red)corresponding to the symptoms’ severity.- Shortcuts through button to display the time of registration: last week, last 15 days, last month, last twomonths- List of the registration periods made.- Ability to select the start date and end of the recording to display- Button for creating real-time PDF with charts of RTSS and dellAsthma score, and description, with thepercentage of days recorded in the period.
https://andro.io/app/allergymonitor
 Power 100


Android app profile
AllergyMonitor for Android – Latest Version & Features
★★★★★
(0 ratings)
Rate this app
How do you feel about AllergyMonitor?
Thanks for your feedback!
> 2.2k
Monthly Downloads
~$900
Estimated Cost
Screenshots